Thursday, May 04, 2006
Illegal Immigration, the Economy, and Statistics
Update 5/25/2006: This post is featured in the 35th Skeptics' Circle, hosted by Skeptico. Welcome, fellow skeptics!
I was inspired by MarkCC's Good Math, Bad Math blog to examine more closely what looked to be a fishy use of statistics. On the continuing illegal immigration debate, I found this New York Times article about the economic impact of illegal immigrants in the United States (discovered via David Neiwert's, Daniel Drezner's, and Kevin Drum's blogs). The main thesis of the article is that economists have analyzed the effect of illegal immigration on the American economy, and discovered that the actual impact has been much lower than expected. To quote the article:
As Congress debates an overhaul of the nation's immigration laws, several economists and news media pundits have sounded the alarm, contending that illegal immigrants are causing harm to Americans in the competition for jobs.The article also presents a graphic showing a comparison between the percentage of illegal immigrants versus the median hourly wage for high school dropouts in 9 selected states.
Yet a more careful examination of the economic data suggests that the argument is, at the very least, overstated. There is scant evidence that illegal immigrants have caused any significant damage to the wages of American workers.
Okay, so this article seems to refute the claim that illegal immigrants are a significant drain on the American economy, right? However, Steve Sailer disagrees with a post on the VDARE blog entitled: The Uselessness of Economists on Immigration. He notes:
An accompanying graphic shows that a high school dropout in California, where supposedly 6.9% of the population are illegal immigrants, averages $8.71 per hour in wages versus merely $8.37 in Ohio, where only 1.0% are illegal immigrants.He then lists the numbers from the article's graphic and adds in the median wages corrected for the cost of living index (corrected wage = 100 * wage/(cost of living index)):
Case closed!
Well, no, not exactly. What about the cost of living difference between California and Ohio? Don’t they tell you in Econ 101 and in Journalism 101 to always adjust for the cost of living?
According to the data gathered by the nonprofit organization ACCRA, which measures cost of living so corporations can fairly adjust the salaries of employees they relocate, California has the highest cost of living in the country with an index of 150.8 (where 100 is the national norm). Ohio is below average at 95.4. So, relative to the national average cost of living, high school dropouts in Ohio average $8.77 versus $5.78 for the equivalent in California. That means they are 52% better off in Ohio.
| State | Illegal Immigrant % by Population | HS Droput Median Wage | Cost of Living Index | Adjusted HS Dropout Median Wage |
|---|---|---|---|---|
| Nevada | 7.5% | $10.05 | 111.8 | $8.99 |
| California | 6.9% | $8.71 | 150.8 | $5.78 |
| Florida | 5.2% | $8.99 | 100.3 | $8.99 |
| Maryland | 4.5% | $9.84 | 125.8 | $7.82 |
| New Jersey | 4.1% | $9.03 | 134.2 | $6.73 |
| New York | 3.3% | $9.02 | 123.5 | $7.30 |
| Nebraska | 2.3% | $9.08 | 93.3 | $9.73 |
| Ohio | 1.0% | $8.37 | 95.4 | $8.77 |
| Kentucky | 0.9% | $8.73 | 91.2 | $9.57 |
He precedes this table with the following comment:
Here’s the data from the NYT’s graphic, in which 9 states were cherry-picked to make it look like the higher the percentage of illegal immigrants in a state’s population, the better off high school dropouts are (r=+0.58). I’ve added the two right hand columns to adjust for the big cost of living differences. We then find a negative correlation of r = -0.46 between the percentage of illegal immigrants and the cost-of-living-adjusted median wage for high school dropouts. Quite a difference!But does this actually refute the point of the article? "Cherry-picking" aside, the article never claims that "the higher the percentage of illegal immigrants in a state’s population, the better off high school dropouts are." Also, I doubt the actual studies done by the economists mentioned in the article only encompasses the data for these nine states.
Mr. Sailer has a point that the newspaper article should have corrected the median wage numbers for cost of living across different states. However, the corrected figures don't exactly prove his contention that illegal immigrants are significantly depressing the high school dropout median wages. He points out the disparity between California and Ohio when the numbers are corrected for cost of living, but ignores the fact that Nevada has a higher percentage of illegal immigrants than even California, and *still* has a higher median wage than Ohio, even after the numbers are adjusted.
In fact, just glancing at the table, it appears to me that the biggest effect on the corrected median wages is in fact the cost-of-living index. Of course, this is not surprising given that the corrected median wages are calculated by and thus dependent on the cost-of-living index. But what about the correlation coefficients Mr. Sailer calculated? Can we draw any meaningful conclusions from them? (If you're unfamiliar with correlation coefficients and their use in statisitics, check the Wikipedia article for a helpful summary.)
Let's calculate the correlation coefficients between every pair of columns in Mr. Sailer's table (numbers and figures generated by UCLA Dept of Statistics' Correlation and Regression Calculator):
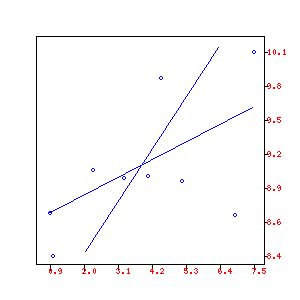 Illegal Immigrant Population % vs HS Dropout Median Wages r = 0.58 | 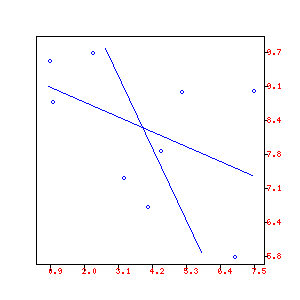 Illegal Immigrant Population % vs Adjusted HS Dropout Median Wages r = -0.46 |
|---|---|
 Cost-of-Living Index vs Adjusted HS Dropout Wages r = -0.96 | 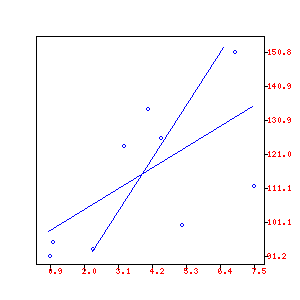 Illegal Immigrant Population % vs Cost-of-Living Index r = 0.63 |
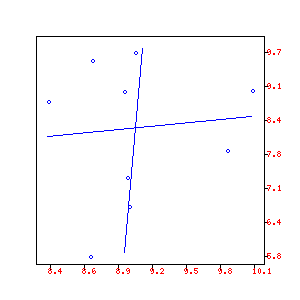 HS Dropout Wages vs Adjusted HS Dropout Wages r = 0.09 | 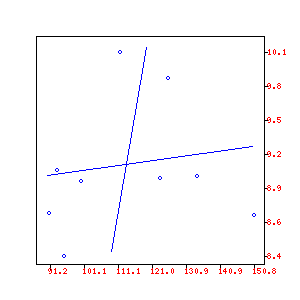 Cost-of-Living Index vs HS Dropout Wages r = 0.16 |
The first row of the table shows the correlation coefficients Mr. Sailer calculated. The values 0.58 and -0.46 seem significant until you look at the data plotted in a graph. Looking at the graph, this data doesn't convince me that there's much of any causal relationship between illegal immigrant population and high school dropout median wage, regardless of whether or not you correct for the cost-of-living index.
In the second row, as I predicted, we see a strong correlation between cost-of-living index and the adjusted HS dropout median wage. But perhaps the illegal immigrant population adversely affects the cost-of-living index, and thus we'd be justified in claiming that the illegal immigration population indirectly affects the high school dropout median wage? Well, the figure on the right graphs the illegal immigrant population vs cost-of-living index. The correlation coefficient is a slightly higher (than the coefficients in the first row) 0.63, but looking at the graph, the data points still look all over the place. That doesn't seem like a convincing causal relationship either.
In the third row, for completeness, I've added the correlation calculations between the other combinations of data columns. These columns do not have relevant relationships to each other and thus it is not surprising that their correlation coefficients are low.
Of course, the real problem is that it's unreasonable to draw any substantial conclusions about illegal immigration's affect on high school dropout median wage from nine measily data points. And I don't think the Times article was trying to do that. The graphic is a supplemental material, and the caption states:
The estimated number of illegal immigrants in a state's population shows no apparent correlation with the median wage for less educated workers in that state.This is a much weaker statement than Mr. Sailer's interpretation that the graphic "cherry-picked" the data to try to make it look like "the higher the percentage of illegal immigrants in a state’s population, the better off high school dropouts are."
I do have to agree that it is misleading to not correct for the cost-of-living index for the median wage figures. But even it that were done, as the analysis above shows, that doesn't invalidate the graphic caption's assertion.
I think a substantial critique of the Times article would address the data actually used in the studies published by the economists. It seems unfair to claim economists are "useless" on immigration without addressing the studies they published, rather than the snippet of data published in the article.
A significant criticism I have with the Times article is that they don't reference the actual studies done. They mention a bunch of economist researchers but don't provide citations to help actually track down the studies. Fortunately we live in the age of Google. For the interested, here are links to the studies mentioned in the article:
- George J. Borjas and Lawrence F. Katz, The Evolution of the Mexican-Born Workforce in the United States
- David Card, Is the New Immigration Really So Bad?
- David H. Autor, Lawrence F. Katz, Melissa S. Kearney, The Polarization of the U.S. Labor Market
Labels: immigration, skepticism
Posted by Big C @ 5/04/2006 10:17:00 PM

Comments:
<< Home
I agree with your premise.
However, I must ALSO note that your own math may be problematic. The tactic of multiple testing (e.g. "Run tests comparing every variable and see what is significant") doesn't work, as you vastly increase your Type 2 error.
Essentially, if you look at enough correlations, some will be significant by change. You need to use an overall analysis as well.

sailorman:
Your criticism is valid. My statistical analysis is flawed as well. But I think this contributes to the point I stated near the end:
"Of course, the real problem is that it's unreasonable to draw any substantial conclusions about illegal immigration's affect on high school dropout median wage from nine measily data points. And I don't think the Times article was trying to do that. The graphic is a supplemental material, and the caption states:The estimated number of illegal immigrants in a state's population shows no apparent correlation with the median wage for less educated workers in that state.This is a much weaker statement than Mr. Sailer's interpretation that the graphic "cherry-picked" the data to try to make it look like "the higher the percentage of illegal immigrants in a state’s population, the better off high school dropouts are."
My point was that to refute the conclusions of the Times article, you have to refute the actual studies done by the economists mentioned. Refuting the article based only on the snippet of data presented is beating up a strawman. To then call economists "useless" on immigration issues based on such a limited analysis is outrageous.
As you say, an additional point is that you'd need to do more sophisticated analyses, in addition to using more complete data.
Post a Comment
Your criticism is valid. My statistical analysis is flawed as well. But I think this contributes to the point I stated near the end:
"Of course, the real problem is that it's unreasonable to draw any substantial conclusions about illegal immigration's affect on high school dropout median wage from nine measily data points. And I don't think the Times article was trying to do that. The graphic is a supplemental material, and the caption states:The estimated number of illegal immigrants in a state's population shows no apparent correlation with the median wage for less educated workers in that state.This is a much weaker statement than Mr. Sailer's interpretation that the graphic "cherry-picked" the data to try to make it look like "the higher the percentage of illegal immigrants in a state’s population, the better off high school dropouts are."
My point was that to refute the conclusions of the Times article, you have to refute the actual studies done by the economists mentioned. Refuting the article based only on the snippet of data presented is beating up a strawman. To then call economists "useless" on immigration issues based on such a limited analysis is outrageous.
As you say, an additional point is that you'd need to do more sophisticated analyses, in addition to using more complete data.
<< Home